How do I design my slides?
How to choose a theme, make each slide ready, and add chart or table data in Design.
Updated 19 November 2026
Introduction
In the Design step, you choose how each slide looks: the deck's theme, each slide's layout, and the data for any chart or table. The words stay in Outline.
Design opens once one slide in Outline has a line. Select Next: Design at the bottom of Outline, or press ⌘⏎ (Ctrl+Enter).
Design has no Consider note. The left margin holds the Layout choices.
How to
Choose a theme
On a client's first deck, Design asks you to Choose a theme for your client before it shows the slides. Each theme shows one of your own slides in it (My deck) when your deck has one to show. To see the theme's sample page instead, select Sample page; My deck goes back. A deck with no slide to show yet shows the sample page.
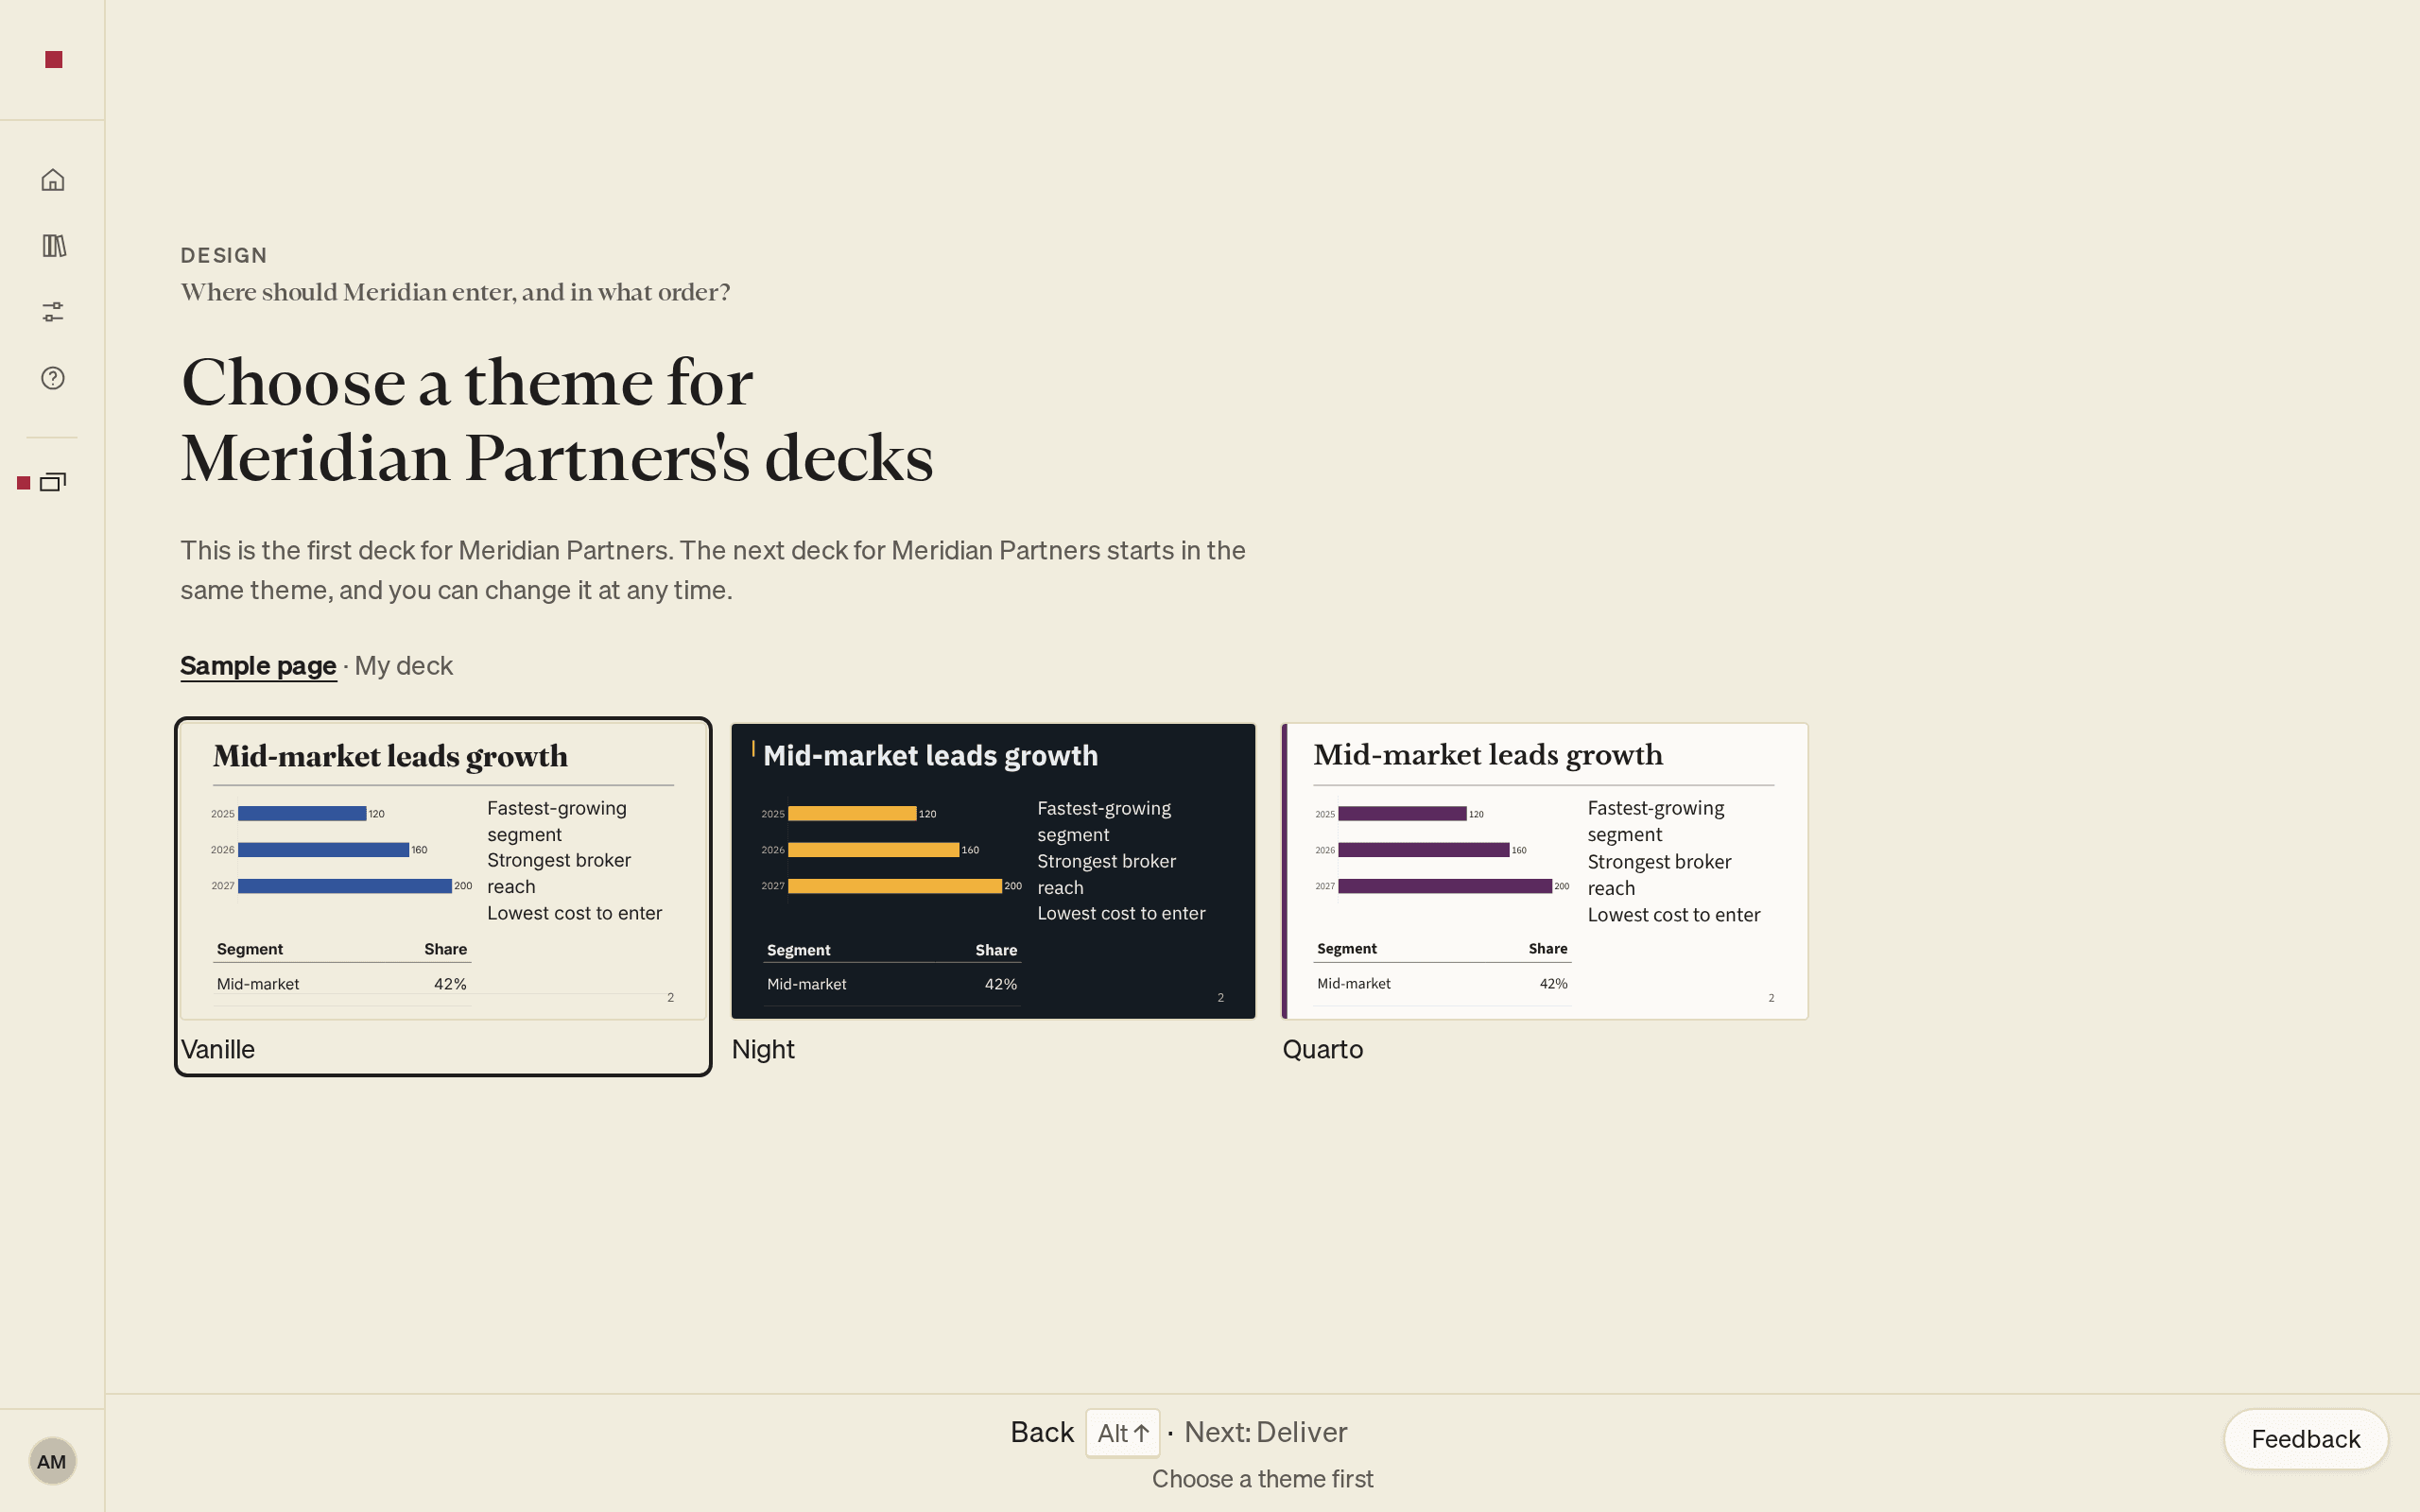
- Look through Vanille, Night and Quarto with the arrow keys or the mouse. Night is the dark one.
- Select the theme you want.
The client's next deck starts in the same theme. To change it, select Change beside the theme's name, or press ⌘K (Ctrl+K) and choose Change the theme. A new theme applies to every slide at once. To undo the change, press ⌘Z (Ctrl+Z).
Each theme uses its own fonts. To see them in PowerPoint, install them on your computer. See Install the fonts.
These three themes are the only ones in the beta. For your firm's full look, restyle the exported file in your firm's PowerPoint master. See After you export.
For logos, use Add a firm logo in Settings or client logos in the Library. These logo controls are separate from choosing a theme.
Make each slide ready
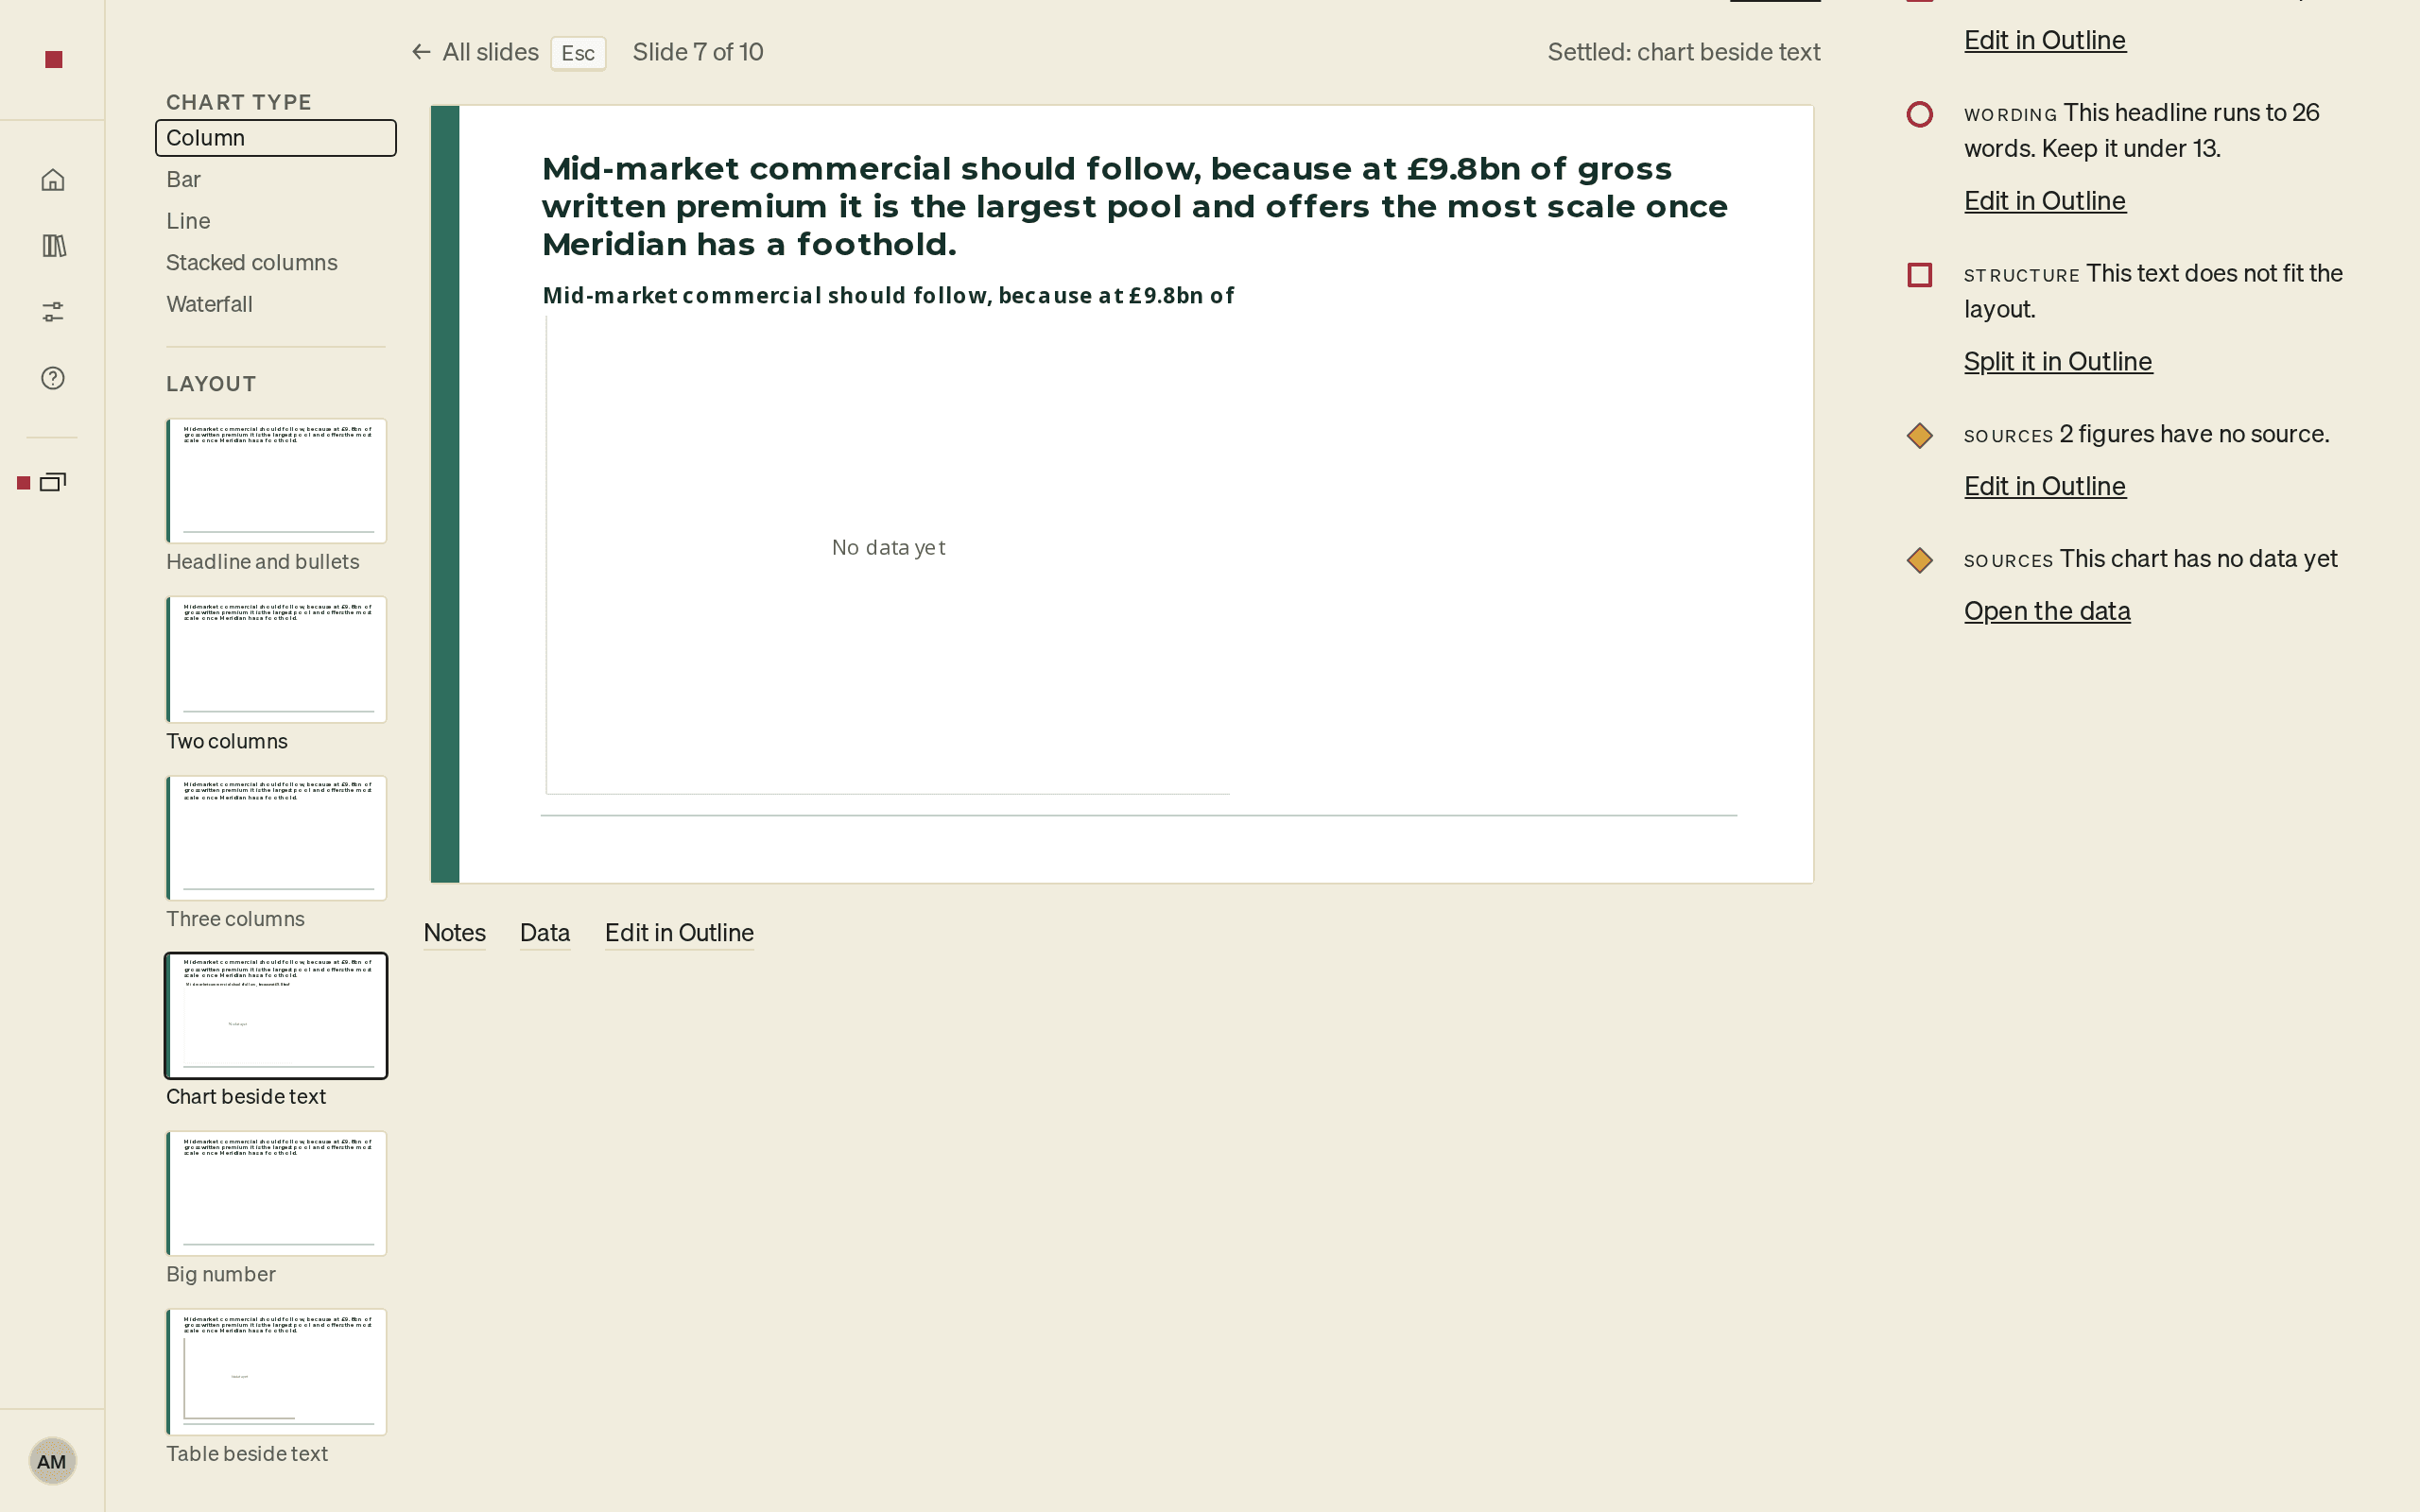
Design shows all your slides. A slide tagged Plain or Sketch is not ready yet. A sketch is a layout PointProven proposes, which you have not applied. The line above the slides names the next one, for example Next: slide 6.
- Select a slide, or move to it with the arrow keys and press Enter.
- Press ← to go to the Layout choices in the left margin.
- Use the arrow keys to preview a layout on the slide. Nothing changes yet.
- Press Enter, or select the layout. The slide is now ready, for example Ready: two columns.
- Press Tab for the next slide, or Esc for All slides.
The layouts are Text only, Two columns, Three columns, Chart, Big number and Table.
The cover, Situation, Complication, the Executive summary, Next steps and the appendix are Laid out by rule. They need no layout choice, and they don't count toward opening Deliver. An appendix slide gets no Layout choices, only the part choices below.
To change a slide's words, select Edit in Outline, or press F2. Speaker notes shows the slide's speaker notes, which you also edit in Outline.
Apply a suggested sketch
When Design opens, PointProven may propose a layout for each slide: a chart, a table or text. A slide's card then reads Sketch, or "Sketch, not applied", with the layout it proposes, drawn in pencil. A proposed chart or table carries a pencil label that names it, for example Column chart or Table.
When your material holds the figures, the sketch fills its chart or table from them, and cites each value. See Data filled from your material.
- Open the slide. In the right column, read the Suggested sketch.
- Select Apply (⌥⏎ or Alt+Enter) to make the slide ready with it, or Dismiss to leave it plain.
If the column says "It uses the plain layout.", for example after No sketch could be made for this slide., select Sketch this slide to ask again, or Choose a layout to pick one yourself. If you edit a slide, PointProven removes its outdated sketch.
Add a chart or a table
To give a slide a chart or a table, choose the Chart or Table layout. To turn one part of the slide into a chart or a table, select that part. Then, under This part as, choose Table or Chart.
While a slide shows a chart, the margin also lists the Chart type: Column, Bar, Line, Stacked columns or Waterfall.
PointProven fills a chart or table only from your material, when you apply a sketch, and cites each value. Otherwise you enter the data yourself:
- On the slide, select Data.
- Type what the chart or table shows in Title.
- Type the Units, for example £m or %.
- Type in the grid, or paste a range from a spreadsheet. In a chart's grid, the first column holds the categories and each other column is a series.
- For a chart, cite its data:
- Under Source of the data, choose a source.
- Fill in Where in it.
- Select Cite it.
- Press Esc to go back to the slide.
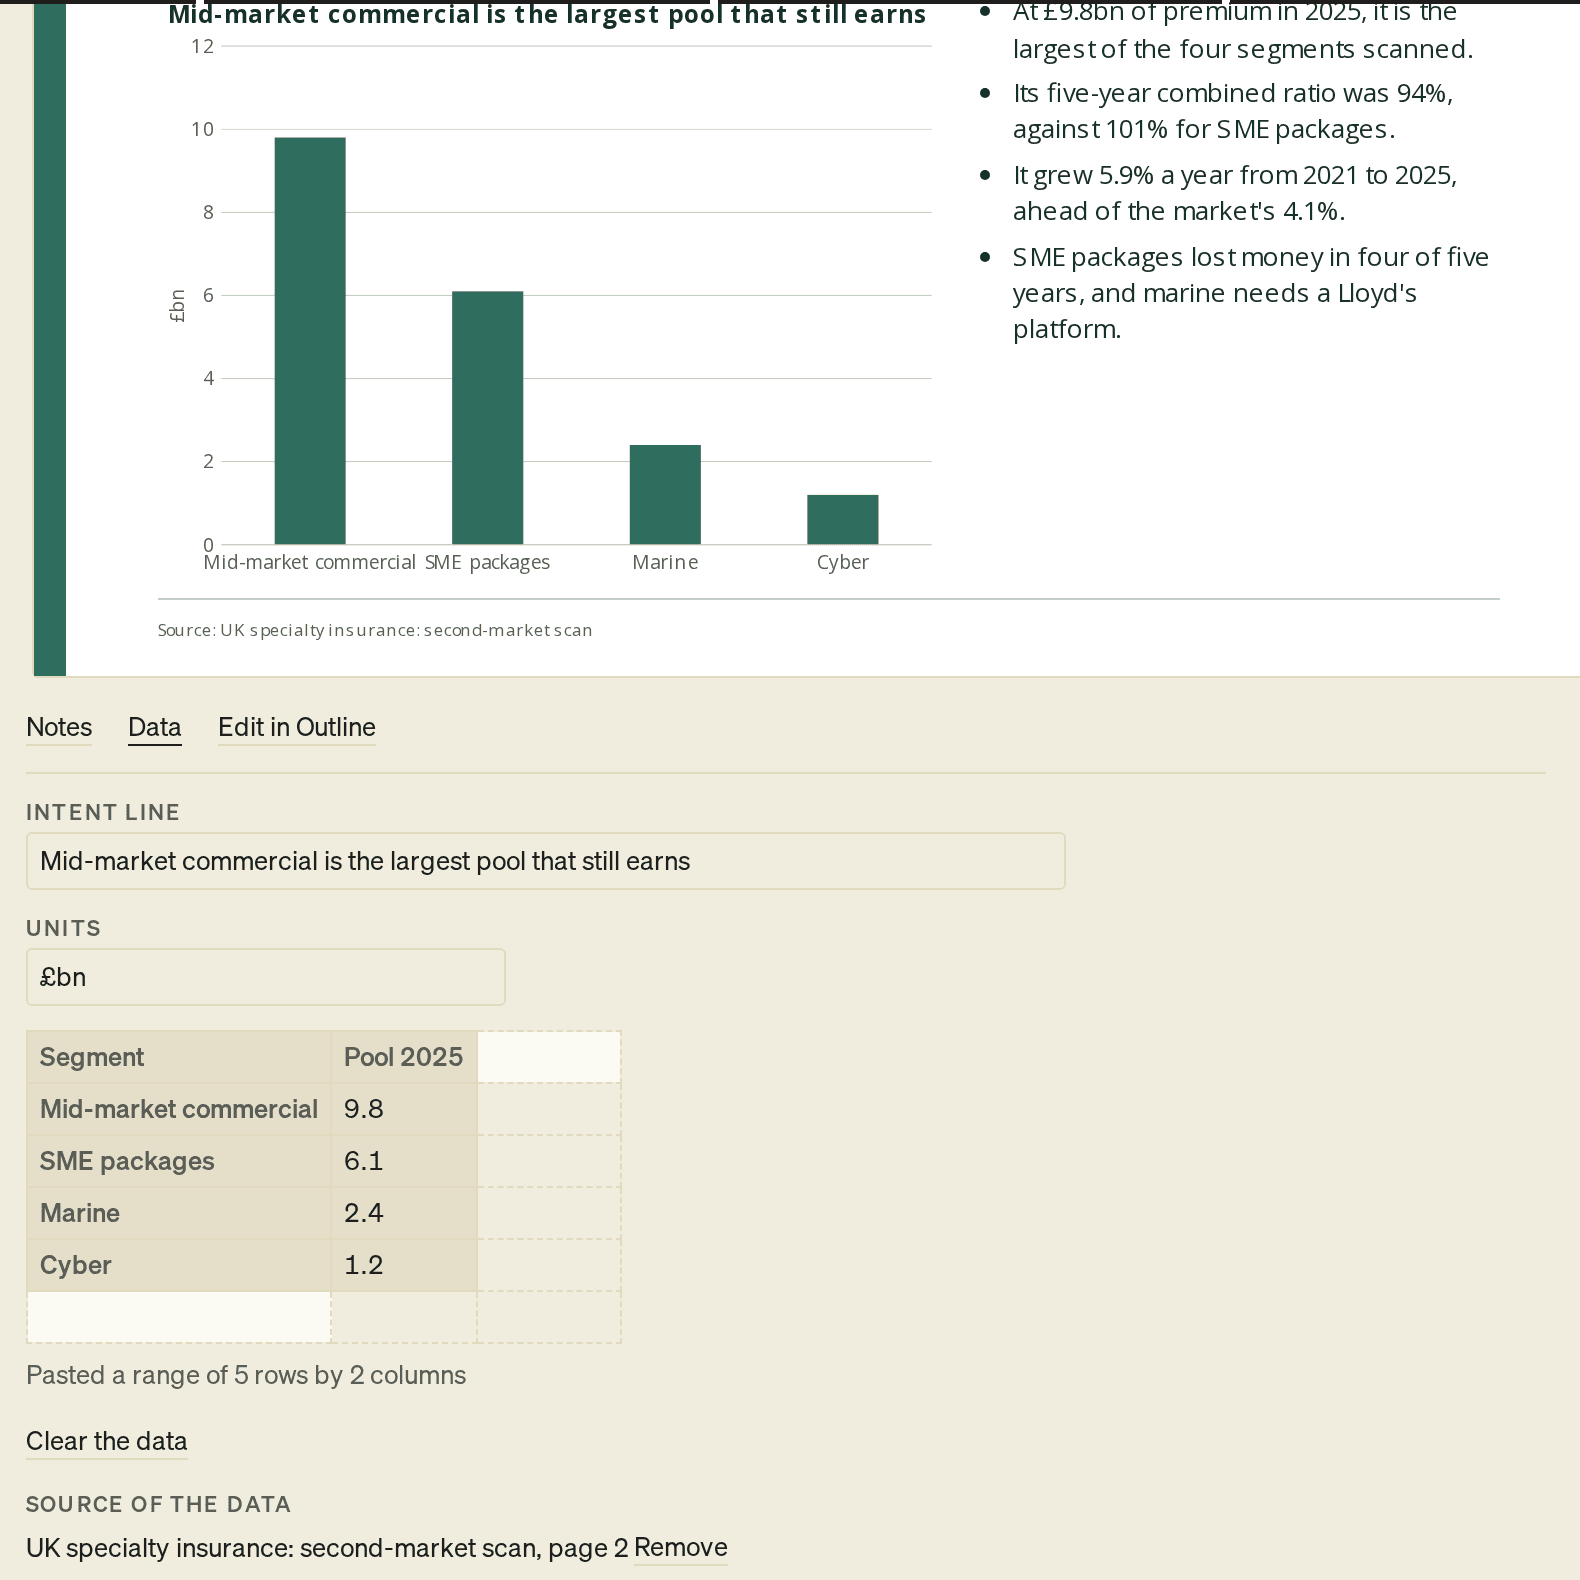
The chart's source joins the slide's source line. See Cite a source.
If you switch to a layout without the chart or table, PointProven keeps the data and shows it again when you switch back. Hidden data does not go into the exported file.
Fix what Design marks
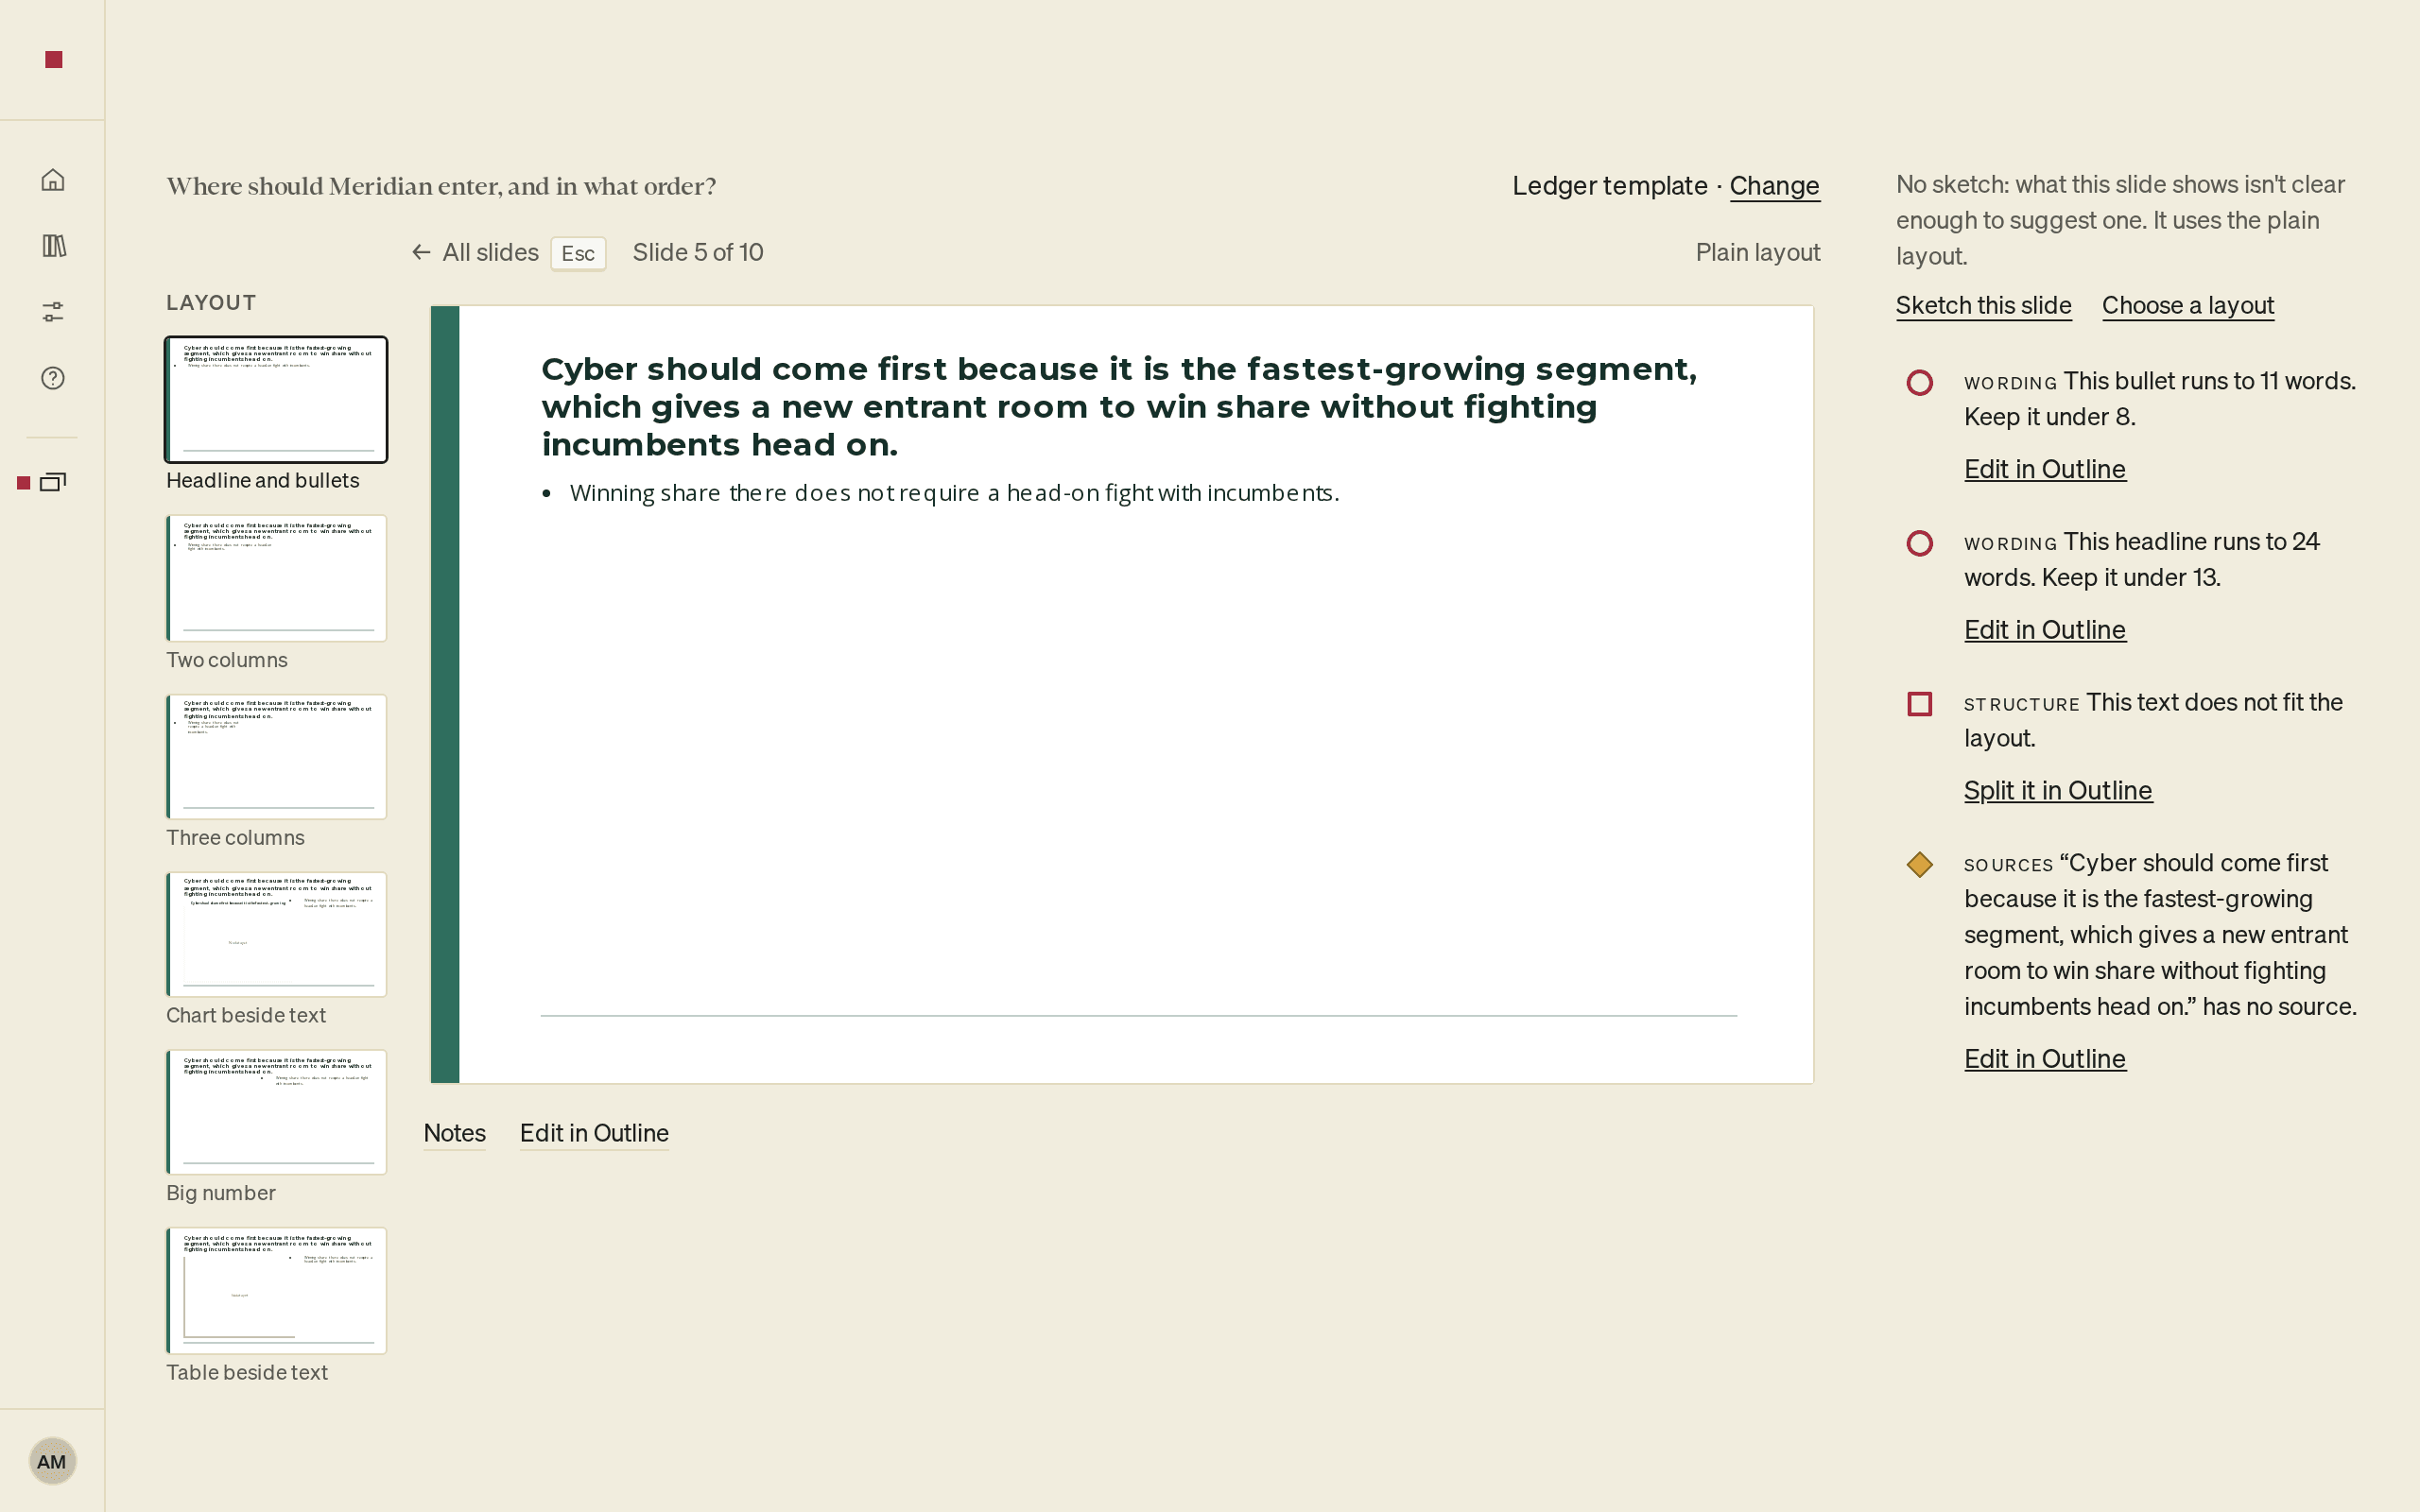
With a slide open, the right column lists every mark on it, most serious first. Each mark has a shape, the category word first (Structure, Logic, Wording, Sources or Evidence), and one action. Slide cards show the same shapes.
Some marks are about the layout, such as This chart has no data yet or This text does not fit the layout. Their fix is Open the data or Split it in Outline. For a mark about your words, select Edit in Outline.
As in Outline, a slide shows at most two Wording, Sources or Evidence marks at a time. A quiet line counts the rest, for example "2 more Sources marks show once these are dealt with." See How quality checks work.
Go on to Deliver
Deliver opens with Design: you don't need to make a slide ready first. Deliver lists the slides that aren't ready yet, each with a link back to it in Design. A slide you leave plain exports with headline and bullets.
Select Next: Deliver at the bottom of the page, or press ⌘⏎ (Ctrl+Enter). You can come back to Design at any time. To export, see Review and export.
FAQs and common issues
Can I use my firm’s PowerPoint master?
Use one of the three beta themes in PointProven, then restyle the exported file in your firm’s PowerPoint master. See After you export.
What happens to data if I remove a chart or table layout?
PointProven keeps the data and shows it again if you switch back. Hidden data does not go into the exported file.
Related articles
Plan your storyline
Turn your argument into slides in the Outline step, with an executive summary, Next steps, an appendix and speaker notes, and know when it is ready for Design.
Charts and tables
Turn part of a slide into a chart or a table in Design, fill its data by typing or pasting, and cite where the numbers come from.