How do I add charts and tables?
How to choose a chart or table in Design, enter data, and cite its source.
Updated 19 November 2026
Introduction
In Design, you choose a chart or table for a slide that supports it. Then you enter the data and cite its source. Or apply a sketch that fills the data from your material, with each value cited.
To open a slide and use the Layout choices, see Design your slides.
How to
Make a part a chart or a table
- Open the slide.
- Press Enter to move into its parts, then use the arrow keys to select the part you want. Or select the part with the mouse.
- Press Esc to return to the slide. The part stays selected.
- Press ← to go to the left margin.
- Under This part as, choose Chart or Table.
To give the whole slide a chart or a table, choose the Chart or Table layout instead.
An appendix slide takes a chart or bullets, not a table, and has no Layout choices. The other slides Laid out by rule take neither.
Choose the chart type
While the slide shows a chart, the left margin lists the Chart type:
- Column
- Bar
- Line
- Stacked columns
- Waterfall
Preview a type with the arrow keys and press Enter to choose it. Your data stays when you change the type.
Fill in the data
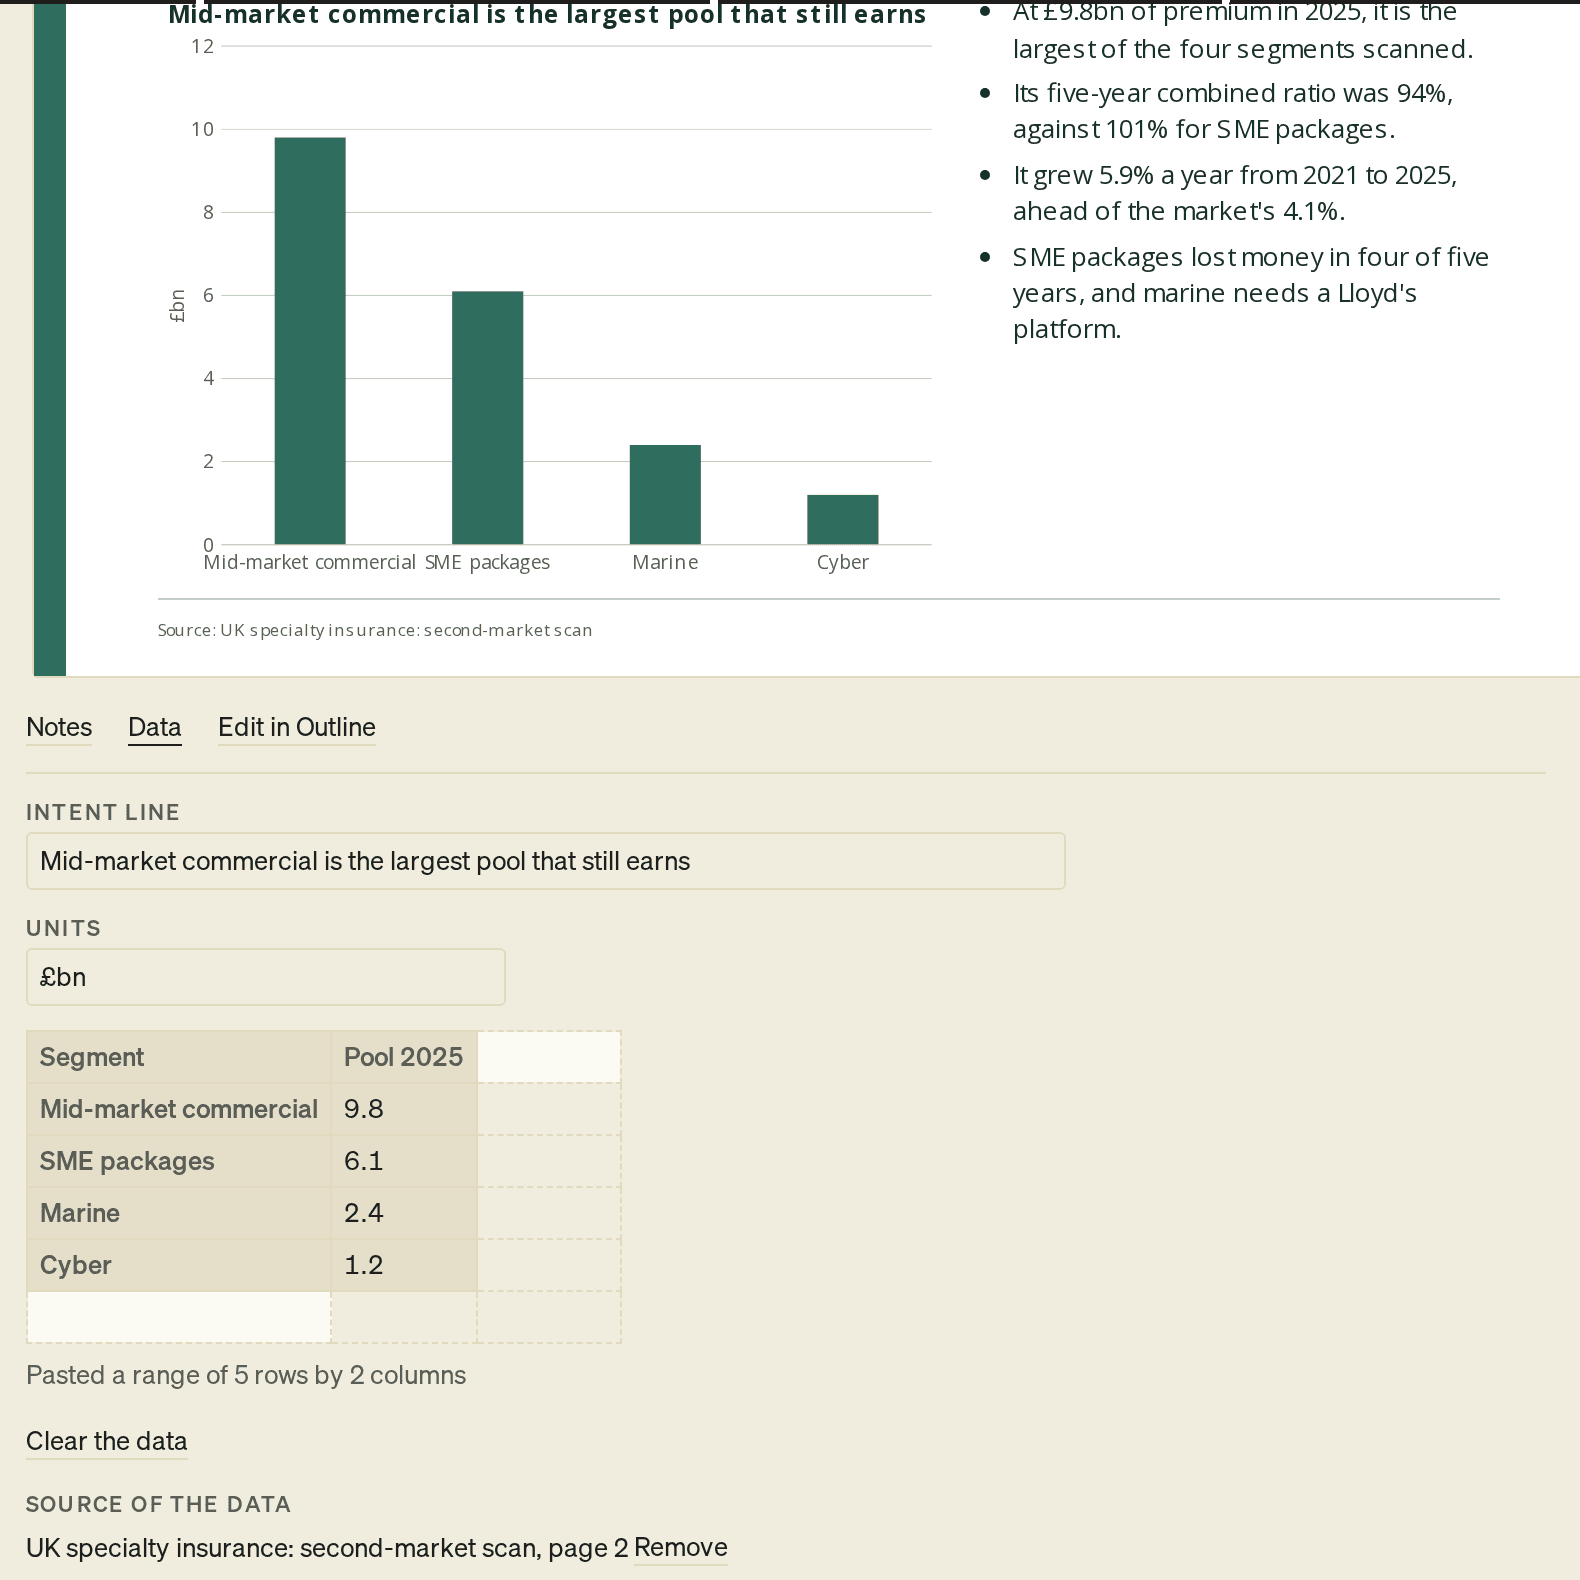
- On the slide, select Data. The Data panel opens under the slide.
- Check the Title. Until you type one, the chart or table takes its title from its data: its measure, unit and period. Type your own to say what it shows. Clear a table's title to go back to its data's.
- Type the Units, for example £m or %.
- Fill the grid. Select a cell and type, or paste a range from a spreadsheet.
- Press Esc to go back to the slide.
In a chart's grid, the first row holds the series names and the first column holds the categories. Each other column is one series.
A pasted range starts at the selected cell, with cells split by tabs and one row per line, as Excel and Google Sheets copy it. The panel confirms it, for example Pasted a range of 5 rows by 2 columns.
A chart takes up to 100 rows and 12 series. A table takes up to 30 rows and 10 columns. A larger paste is refused.
Each change to a cell redraws the chart or table on the slide. ⌘Z (Ctrl+Z) undoes one change at a time.
Data filled from your material
When you apply a sketch with a chart or table, PointProven fills it from your material. The Data panel then says Filled from your sources: each value is cited, word for word. A value you type over becomes yours.
- Each value is written as your material writes it, and cited to the place it comes from.
- A value PointProven cannot cite stays blank, for you to fill in.
- A chart or table that already holds data keeps it. Design says This slide's chart or table already holds data, so the sketch doesn't fill it. Clear the data to use the sketch's.
- If a source the sketch cites has changed, Design says A source this sketch cites has changed. Sketch the slide again.
A chart or table you fill yourself says The data is yours: nothing is filled in for you.
Mark the totals in a waterfall
A waterfall's grid has a Total column of tick boxes. A row you tick is a total. Its bar stands from zero. Every other row steps up or down from the running total.
When a waterfall first gets data, PointProven ticks its first and last rows. Tick or untick rows to change them.
Clear the data
To empty the grid, select Clear the data in the Data panel. ⌘Z (Ctrl+Z) brings the data back.
If you switch to a layout without the chart or table, PointProven keeps the data and shows it again when you switch back. Hidden data does not go into the exported file.
Cite the data
A chart needs a source, like any figure. Use Source of the data in the Data panel.
To use a source the deck already has:
- Pick it from Choose a source.
- Type the page or table in Where in it, for example page 12.
- Select Cite it.
To add a source by hand, select Add a new source, fill in the form, then select Save the source. The form is the one described in Cite a source by hand.
The chart's source joins the slide's source line. To change it, select Remove beside it and cite again.
Fix a chart's or a table's marks
Design marks a chart or a table in the right column while its slide is open. Each of these marks has the Sources shape (a diamond), and the word Sources leads the finding:
- This chart has no data yet or This table has no data yet
- This chart has no source
- Shares don't sum to 100%
- Not in the cited passage
Each mark offers Open the data. See What each indicator means.
FAQs and common issues
Why can I not add a table or change the layout?
An appendix slide takes a chart or bullets, not a table, and has no Layout choices. Other slides Laid out by rule take neither a chart nor a table.
Why was my pasted range refused?
A chart takes up to 100 rows and 12 series. A table takes up to 30 rows and 10 columns. A larger paste is refused.
What happens to data when I change the layout?
PointProven keeps the data if you switch to a layout without the chart or table. Switching back shows it again. Hidden data does not go into the exported file.
Related articles
Design your slides
Choose a theme, make each slide ready with a layout, and add your chart and table data in the Design step, so Deliver can open.
Review and export
Read the lines PointProven lists before export, export your deck to PowerPoint with or without your speaker notes, download it and export again after changes.